
In this article, we will step through all the steps required to enable debugging on your PHP environment.
The setup we will use is: WAMP 2 with PHP 5.3, Eclipse Helios with PDT.
Setting up the development environment
Obviously, the first step is to install WAMP, then to install Eclipse Helios (use the Eclipse for PHP release version). I will assume in this article you have a basic understand of Wamp and Eclipse PDT.
Download and configure XDebug
Start Wamp Server. In order to get the right version of XDebug, we will need to have a look at the php_info() screen. On a WAMP server, this screen can be accessed easily at: http://localhost/?phpinfo=1

XDebug provides a "find binary page" that can analyze your php_info(), and propose the best XDebug version for you. So just perform a huge "copy" in the clipboard of your php_info() page, and paste it into the XDebug find binary page as shown below:

This page is somewhat magical. Just click on the "Analyse my phpinfo() button", and XDebug will output the complete installation instructions:

Follow the install instructions:
- download the xdebug dll file
- put it in the target directory
- edit your php.ini file
the Find binary page has a slight bug. It fails to tell you a correct PHP path if you installed WAMP in a directory that has spaces (for instance, it will fail if you installed wamp "in Program Files". If you did so, pay special attention to the paths XDebug tells you, and copy the XDebug DLL in [wamppath]binphpphp5.3.0ext.
You will now need to setup the XDebug parameters to connect to your debugger.
Add these lines to your php.ini file:
xdebug.remote_enable=1 xdebug.remote_host="localhost" xdebug.remote_port=9000 xdebug.remote_handler="dbgp"
You can find more information on remote debugging setup in the XDebug remote debugging manual.
Now, restart your Wamp server.
Setup XDebug in Eclipse
We will now configure Eclipse to connect to the debugger. Open one of your PHP projects. In this tutorial, I will be debugging a Drupal project, but you can really debug on web site developped with PHP.
Put a breakpoint in your code (by double-clicking in the left margin in your code.

Now, go to the debug configuration screen.

Right click on "PHP Web Page", then "New"

Select "XDebug" has the debugger.
In "File", select the first file that will be triggered when you access the web page.
As an advice, you should not use the "Auto Generate" URL feature, as it will almost be wrong if you use Apache Aliases or URL Rewriting. So uncheck the "Auto Generate" checkbox, and point the URL to the web page you want to debug.

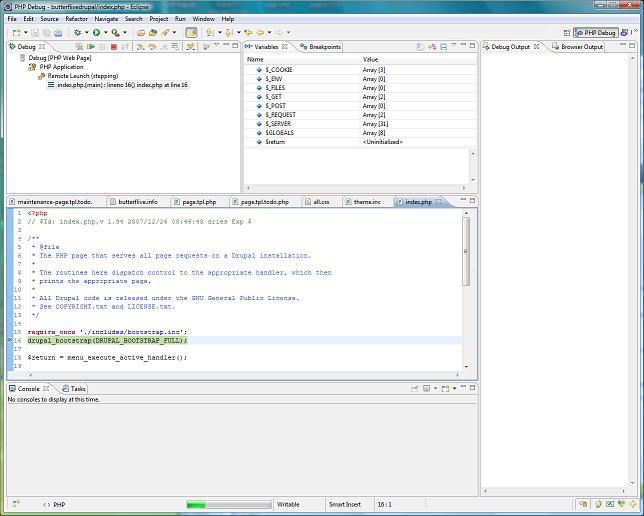
Start debugging!
Everything is correctly set-up? Click "Debug"! If you have correctly set up your environment, Eclipse should switch in debug mode and you should halt on your break-point.
Congratulations, your debugging environment is set-up, you can stop using var_dump(), and start being efficient :)
Going further with the debugger
You might have noticed that by default, Eclipse uses an integrated browser. I've written a quick follow-up to this article, if you want to use your default OS browser rather than Eclipse one.
About the author
David is CTO and co-founder of TheCodingMachine and WorkAdventure. He is the co-editor of PSR-11, the standard that provides interoperability between dependency injection containers. He is also the lead developper of GraphQLite, a framework-agnostic PHP library to implement a GraphQL API easily.