WorkAdventure is a platform that uses, at its core, a video-game engine, to provide a virtual office environment. Because the application is a virtual office, it needs to run 100% of the time, in the background. It is therefore important that the application does not draw too much power (which causes laptops to overheat, battery to drain faster and computers to be less responsive)
Game.step method.In this article, I'll describe the steps I went through to reduce the power usage of WorkAdventure. WorkAdventure is based on the Phaser game engine, and is rendering the game using Tilemaps.
Because WorkAdventure uses the "Request Animation Frame" API, the browser is already doing quite a bit of optimization by itself. In particular, the game loop is stopped if the browser window is not visible (this is of course stopping any energy consumption from the engine). What I am interested in is reducing power consumption when the game is visible (either because the application is at the foreground or because the application runs on a secondary monitor...)
Measuring power consumption / CPU & GPU load
Measuring CPU & GPU load of an application like WorkAdventure is actually quite complex. Load is split on the CPU and
the GPU, and classic tools (like top) are doing finally a poor job at explaining what is going on.
We use 2 tools to measure energy consumption:
- Google Chrome task manager. It can analyze the amount of CPU used by a tab, and by the GPU (with the asumption that higher CPU/GPU usage means higher energy consumption)
- the
powertoputility on Linux that can measure the rate at which a battery is unloading. This gives us a coarse value, but is also the only measure that is actually looking at the speed at which batteries are drained
Test bench
Tests are performed on a Dell XPS 9550.
Screen luminosity is set to minimum. The browser is actually displayed on an external monitor. No programs are running except the browser (and powertop).
OS: Ubuntu 20.10
Graphics card: Mesa Intel® HD Graphics 530 (SKL GT2)
Base consumption when computer is idle is measured at ~11W.
Starting point
Our starting point is WorkAdventure, version 1.2.6.
WorkAdventure is internally using the Phaser game engine.
Version 1.2.6 uses Phaser 3.24.
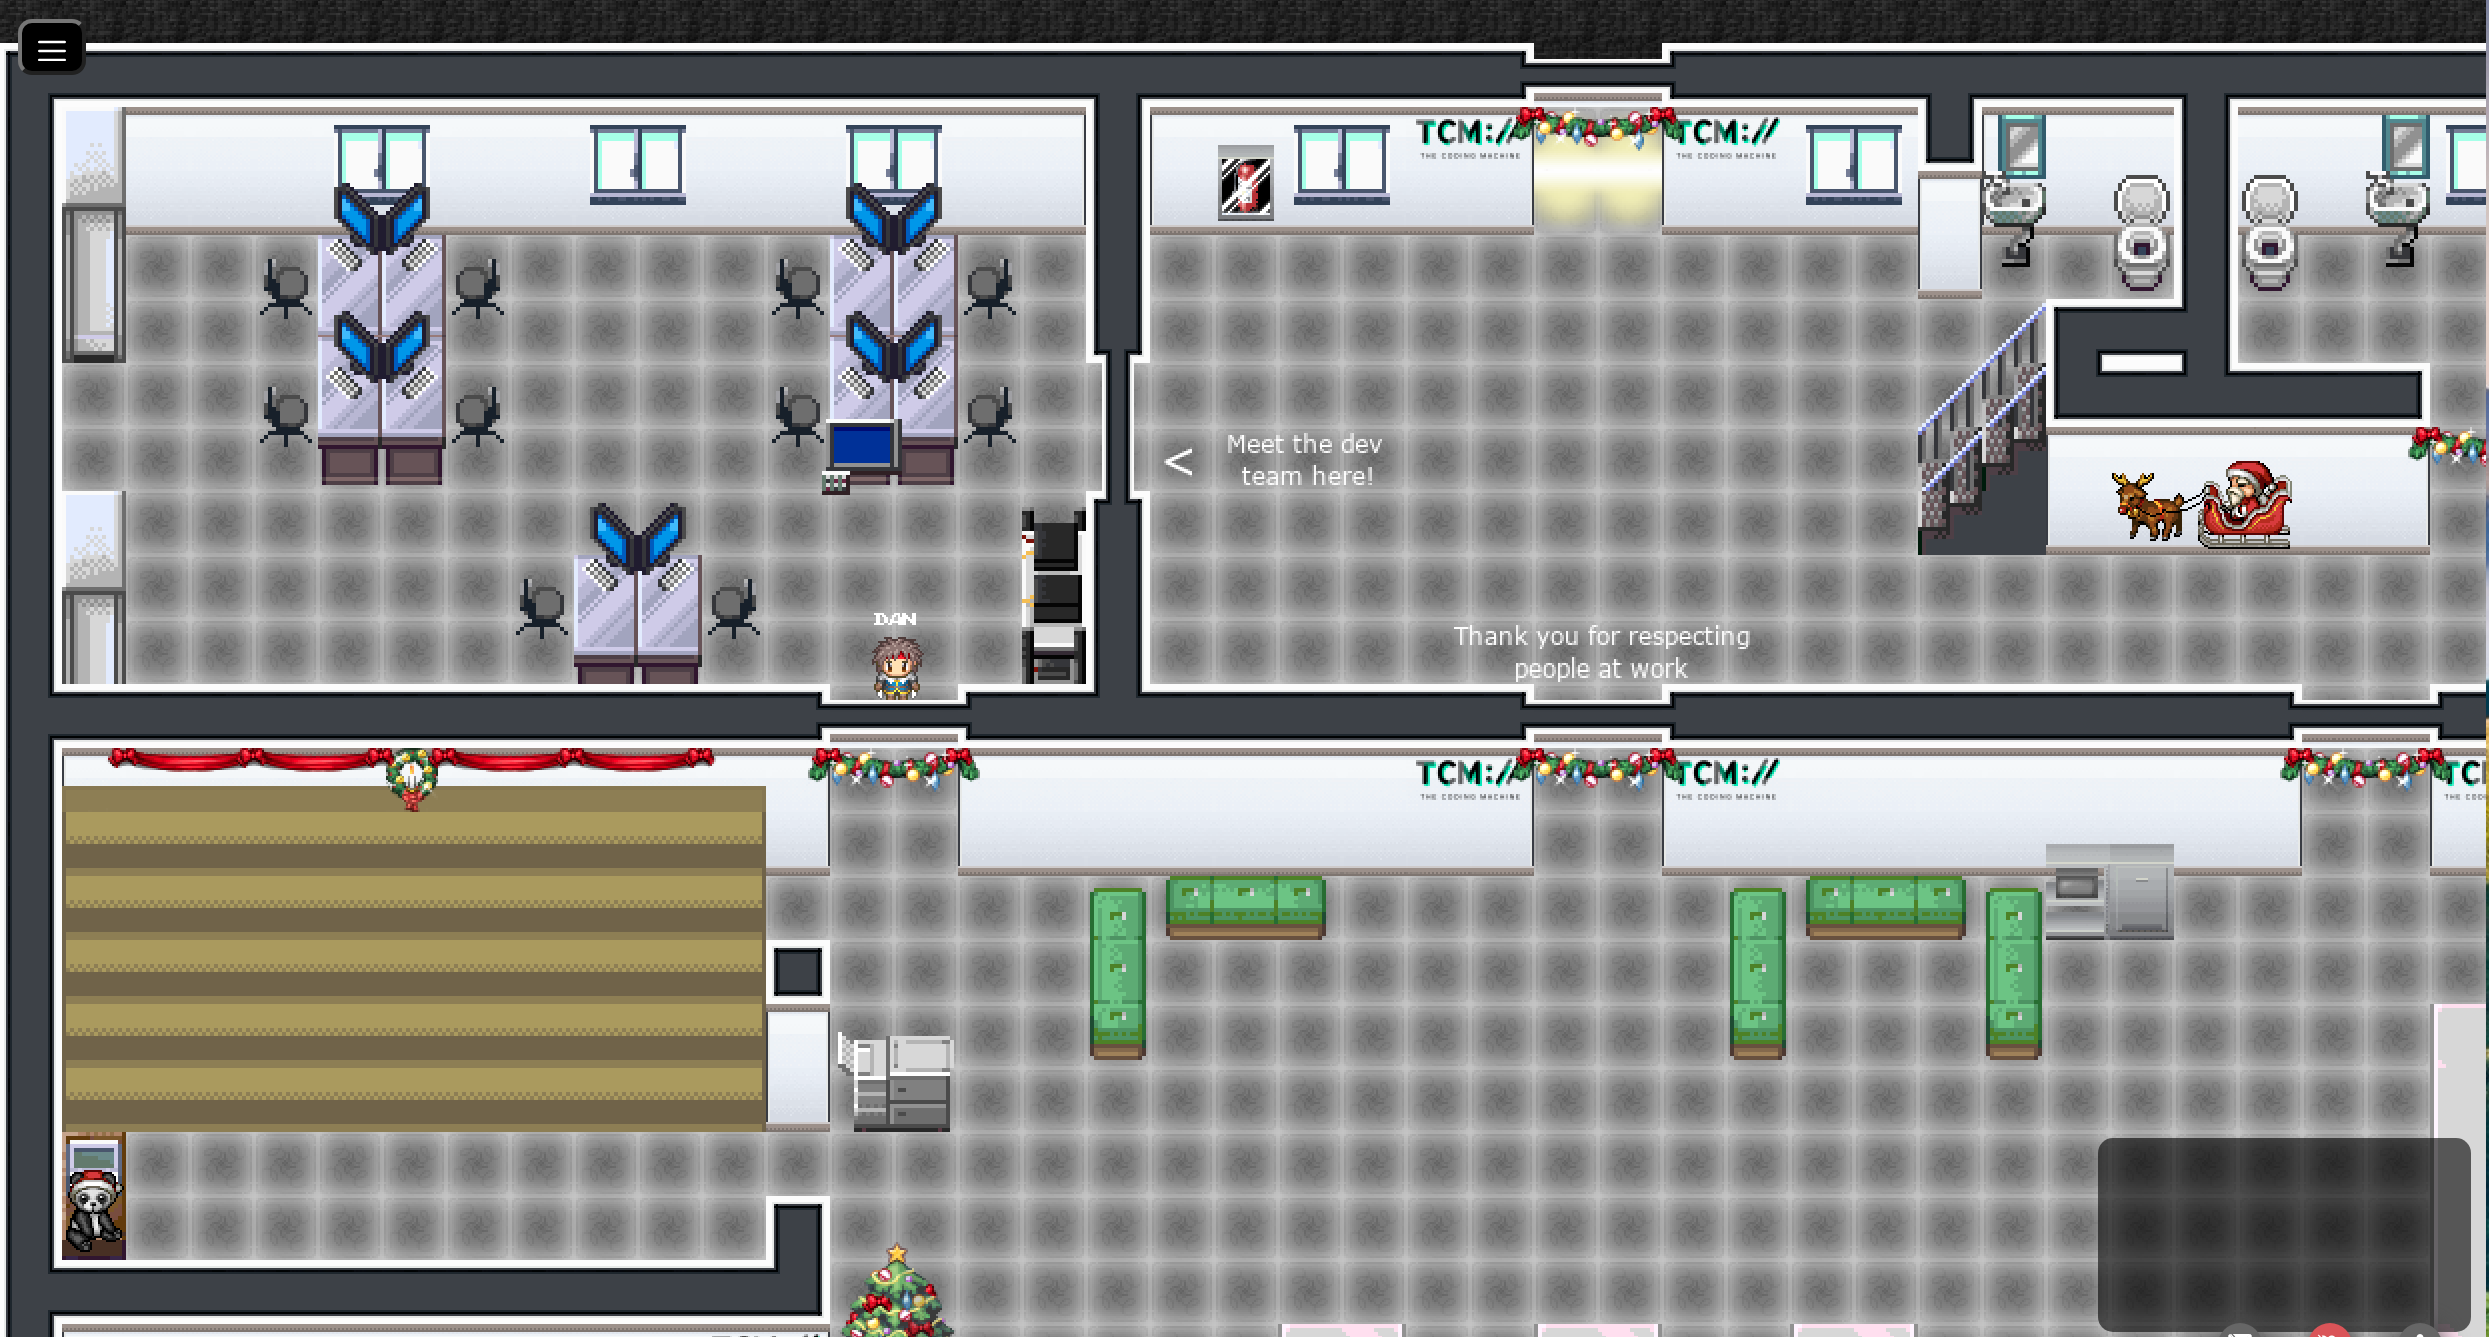
The scene we are working on is a simple map, using tilemaps designed with Tiled:

Phaser internally uses WebGL if available. Before Phaser v3.50, Phaser is using a single texture in the WebGL pipeline. This means that when drawing a sprite, the texture needs to be loaded from the RAM to the GPU. If the next sprite is on a different spritesheet, the previous texture will be flushed from the GPU and a new texture will be loaded.
Each texture switching will incur an additional "draw" call. And it is a good practice to reduce draw calls.
In order to measure the number of draw calls, we can use SpectorJS. It is a browser extension that can be used to debug calls to the WebGL API.
Using Phaser 3.24, the number of draw calls measured with our test map is ~60 calls.
That can certainly be optimized.
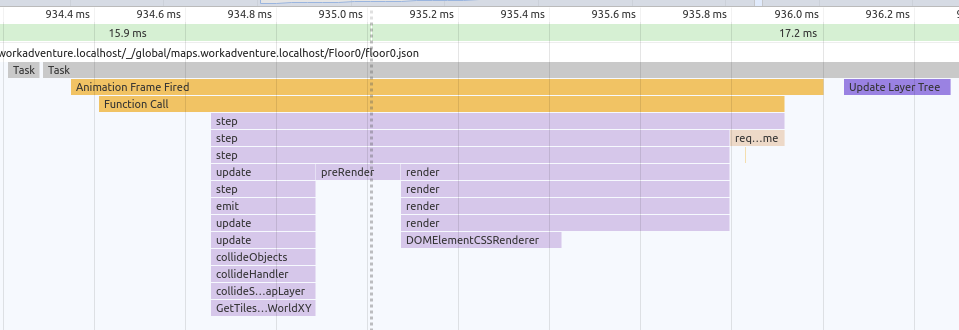
Looking at the performance tab in Chrome, we can see something like this for each frame:

Phaser performs the rendering of each frame in 2 steps:
- First, call the
updatemethod of the scenes (0.35ms) - Second, call the
rendermethod of the scenes (1.13ms) - GPU time spent per frame (0.77ms)
Step 1: migrating to Phaser 3.54
Starting with Phaser 3.50, Phaser comes with multi-texture support. The number of textures you can load depends on the browser and on the GPU you are using.
On my machine, I can load up to 32 textures in the GPU at once. This should be enough for a map (but could be not enough if there are many characters displayed, since in WorkAdventure, characters all have their specific spritesheet). The value varies with your hardware. The only thing we know is that we can put at least 8 textures in the GPU (this is mandated by the WebGL spec).
Using Phaser 3.54, the number of draw calls measured with our test map is reduced dramatically: only 2 calls!
So this should have a dramatic impact on performance, right? Right???
After this, the display of a single frame in Chrome performance monitor look like this:

- First, call the
updatemethod of the scenes (0.35ms) - Second, call the
rendermethod of the scenes (1.85ms) - GPU time spent per frame (0.32ms)
Damn it! Phaser 3.54 takes longer than Phaser 3.24.
Looking at the details, in Phaser 3.24, we are using a StaticTileMapLayer that was replaced with a pure TileMapLayer
in Phaser 3.50. The TileMapLayer is doing some "culling" on each frame to display only the tiles we need.
For instance, the RunCull function is called on each loop.
This culling explains in part why each render call takes longer. This should be offset by less burden on the GPU
and of course improved texture management.
So in the end, what do we see?
| Step | update |
render |
CPU | GPU | Power |
|---|---|---|---|---|---|
| Phaser 3.24 | 0.35ms | 1.13ms | 35 to 60% | 33 to 38% | 18.5W |
| Phaser 3.54 | 0.35ms | 1.85ms | ~43% | ~29% | 18.8W |
Nothing to notice. Results are very similar.
Step 2: using a RenderTexture
The next idea to improve performance and lower energy consumption is to avoid doing too much computing when drawing the tiles.
Our idea is to render tiles on two intermediate "RenderTexture".
A RenderTexture is a texture on which we can render things.
The idea is that all the layers below the floor are rendered on a "bottom" RenderTexture, and all the layers above the characters are rendered in another "top" RenderTexture. The width and height of the RenderTextures are just a few pixels bigger than the camera size. As long as the camera stays inside the RenderTexture bounds, there is no need to redraw the tilemap on the RenderTexture. From WebGL point of view, we are rendering two big textures rather than small tiles.
Results are self-speaking:
updatemethod: 0.17msrendermethod: 0.62ms- GPU time spent per frame: 0.32ms

| Step | update |
render |
CPU | GPU | Power |
|---|---|---|---|---|---|
| Phaser 3.24 | 0.35ms | 1.13ms | 35 to 60% | 33 to 38% | 18.5W |
| Phaser 3.54 | 0.35ms | 1.85ms | ~43% | ~29% | 18.8W |
| Phaser 3.54 with RenderTexture | 0.17ms | 0.62ms | ~31% | ~29% | 18.6W |
So the fact that we have 2 big textures instead of a tilemap made of many tiles changes nothing to the time spent by the GPU to draw the scene. However, it has a direct impact on the JS side where we don't need to do the culling so often.
Note: it should probably be possible to "cache" the culling results in Phaser and that would probably have the same effect.
Comparing those results with the results of a dead simple scene
At this point, it is interesting to look at what is the cost of a very simple scene. For this purpose, we are going to compare our results to the results of the "login" scene of WorkAdventure (as of v1.2.0). This scene is a black screen with 4 BitmapText. It is as simple as it can get.
The login scene

This measure will help us understand what is the cost of Phaser itself (and running the event loop with RAF).

- First, call the
updatemethod of the scenes (0.22ms) - Second, call the
rendermethod of the scenes (0.66ms) - GPU time spent per frame (0.35ms)
These results are exactly the same as the ones we get with the RenderTexture optimization!
| Step | update |
render |
CPU | GPU | Power |
|---|---|---|---|---|---|
| Phaser 3.54 with RenderTexture | 0.17ms | 0.62ms | ~31% | ~29% | 18.6W |
| LoginScene | 0.22ms | 0.66ms | ~33% | ~30% | 18W |
Let's face it, I found those results astonishing. The LoginScene is putting the same load as the complete game scene with the tilemap loaded.
The login screen and the game screen have similar performances. If we want to dig deeper in performance optimization, we need to change things at the Phaser level now.
Step 3: rendering only when needed
For the performance tab in Chrome, we can see that we spend about 2/3 of the time in each frame in render.
For each requested animation frame (RAF) in Phaser, Phaser calls the "update" method, then the "render" method of each scenes. The "render" method takes some time (and energy) to perform the rendering.
The fact is we probably don't need to call "render" if nothing changed on the screen. In most games, there is always something changing on the screen, an animation going on, etc... But in WorkAdventure, it is common to have 2 successive frames that are exactly the same.
If we could find a way to not call render if nothing has changed in the game, we could prevent most of the work in each RAF. We could lower power consumption tremendously.
The problem is that out of the box, Phaser has no way to support a "dirty" flag. Phaser can display several "scenes" at the same time. So we added a "dirty" flag on all scenes, and we modified Phaser "events loop" so that is does not call render at all if all the scenes is pristine.
For each "RAF", Phaser calls the render method.
step: function (time, delta)
{
  if (this.pendingDestroy)
  {
    return this.runDestroy();
  }

  var eventEmitter = this.events;

  //  Global Managers like Input and Sound update in the prestep
  eventEmitter.emit(Events.PRE_STEP, time, delta);

  //  This is mostly meant for user-land code and plugins
  eventEmitter.emit(Events.STEP, time, delta);

  //  Update the Scene Manager and all active Scenes
  this.scene.update(time, delta);

  //  Our final event before rendering starts
  eventEmitter.emit(Events.POST_STEP, time, delta);

  var renderer = this.renderer;

  //  Run the Pre-render (clearing the canvas, setting background colors, etc)
  renderer.preRender();

  eventEmitter.emit(Events.PRE_RENDER, renderer, time, delta);

  //  The main render loop. Iterates all Scenes and all Cameras in those scenes, rendering to the renderer instance.
  this.scene.render(renderer);

  //  The Post-Render call. Tidies up loose end, takes snapshots, etc.
  renderer.postRender();

  //  The final event before the step repeats. Your last chance to do anything to the canvas before it all starts again.
  eventEmitter.emit(Events.POST_RENDER, renderer, time, delta);
},
The code is clearly split into 2 parts => update and render.
What we did was essentially to add a "if" statement around the "render" part. Our code looks like this:
step: function (time, delta)
{
    // update part
    // ...

    if (this.isDirty()) {
        // render part
        // ...
    } else {
        // The update part is setting isProcessing = true and the render part must set it back to false as a side effect
        this.scene.isProcessing = false;
    }
},
The implementation of isDirty() has to be game specific so far. It would be too difficult to track all the things that
can change (especially the x,y position of all GameObjects would need to be tracked, along animations, etc...)
So we are essentially tracking user input, network events, and setting the dirty flag accordingly.
You can actually see the PR implementing this optimization here.
We also implemented an additional change: we are disabling the physics engine when the character is not moving. There is no point in checking collisions if nobody moves, right?
Results:

| Step | update |
render |
CPU | GPU | Power |
|---|---|---|---|---|---|
| No browser | N/A | N/A | N/A | N/A | ~11W |
| Phaser 3.24 | 0.35ms | 1.13ms | 35 to 60% | 33 to 38% | 18.5W |
| Phaser 3.54 | 0.35ms | 1.85ms | ~43% | ~29% | 18.8W |
| Phaser 3.54 with RenderTexture | 0.17ms | 0.62ms | ~31% | ~29% | 18.6W |
| LoginScene | 0.22ms | 0.66ms | ~33% | ~30% | 18W |
| Phaser 3.54 with dirty flag (and RenderTexture) | 0.16ms | N/A | 11% | 4% | 11W |
The difference is staggering!
The energy cost of the update function is barely noticeable, and looking at powertop only, I cannot say if the game
is running or not. Hooray!
And what about canvas resolution?
Not all games can stop rendering on some frames. If your game is heavy on animations, the technique above won't do anything.
Another element that is known to have a big impact on performance is the resolution of the canvas element.
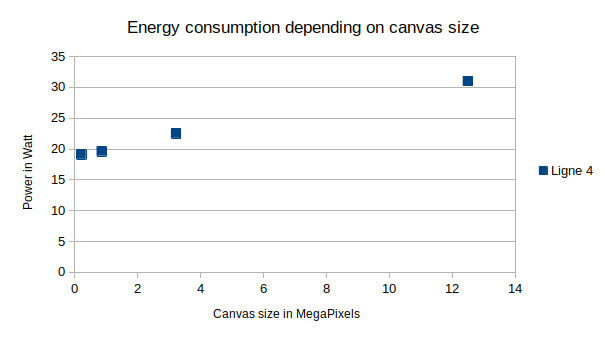
I've done some tests to measure the amount of power consumed by canvases of different sizes.
I performed those tests using the "Phaser 3.54".
Here are the results:
| Resolution | Power |
|---|---|
| 640x335 | ~19.1W |
| 1280*670 | ~19.6W |
| 2400*1341 | ~22.5W |
| 4800*2600 | ~31W |
Drawn on a graph:

Those results are interesting. It seems that once you account for a base load, energy consumption is directly proportional to the number of pixels drawn on a canvas. For large displays (4K), GPU drawing pixels becomes the main source of power consumption from the game.
Conclusion
As a conclusion, we can say that most of the energy is burned by the GPU.
Classic advices to optimize the performance of a game (limiting the calls
to draw functions, etc...) have little to no effect on energy consumption
However, disabling the rendering and calling it only when something actually moves has a tremendous effect. Of course, in most games, there is always something moving on the screen, and this advice might not apply. But if you use Phaser for something else than a classic video-game, using a dirty flag to render the scene when needed is tremendously efficient.
About the author
David is CTO and co-founder of TheCodingMachine and WorkAdventure. He is the co-editor of PSR-11, the standard that provides interoperability between dependency injection containers. He is also the lead developper of GraphQLite, a framework-agnostic PHP library to implement a GraphQL API easily.
